|
Home
Tech Articles
Off road
Baja Specs
Vee Wrx
|
VW Cooling Fan.
Under Construction, sorry about the large pictures, I'm working on making them smaller. Some of the text is taken straight from my thesis, so it may get a little technical. I have rewritten some of the tricky bits in an easier to understand format. |
Air Flow vs Fan Speed curve for the VW cooling fan.

This chart shows the air flow vs fan speed chart for the early thin fan and the later dog house wide fan. Myself and two friends built a cooling fan test rig as part of our final year mechanical engineering thesis. We used it to calculated the air flow curves for the VW cooling fan, hence the points shown on the chart.
I wanted to calculate what the fan air flow rates actually were, because I had seen all sorts of strange quotes in VW magazines and else where. I had seen single flow rate figures quoted, which meant nothing because they didn't say what fan speed it was measured at.
Other silly comments suggested that the fan reached maximum flow rate at 4,000 engine rpm, which was ridiculous from an engineering perspective. The fan will physically explode before it reaches a maximum flow rate. I suspect the apparent maximum flow of the vw fan was actually due to the fan belt slipping at a certain rpm, therefore the fan speed did not increase any further.
During our tests we measured the fan speed and not the engine speed, therefore knew when the fan belt started slipping. We noticed it didn't take much to get the fan belt to slip either, and it also made no noise so without measuring the fan speed you wouldn't know that it was slipping. |
How the fan speed was measured.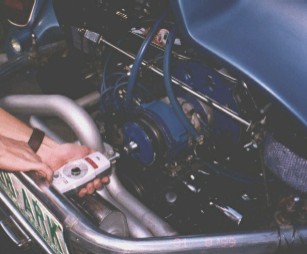
This photo shows the hand held tacho used to measure the fan speed. The end of the tacho is held against the generator pulley nut, this then turns the tacho. The tacho is calibrated regularly and will read up to 20,000rpm in numerous different scales. |
Air Flow vs Engine Speed curve for different crank pulleys.
This chart is derived from the previous chart (air flow vs fan speed). This chart shows air flow vs engine speed. By adjusting the shims on the generator pulley, you get a maximum and minimum crankshaft to generator pulley diameter ratio for both the standard and power style crank pulleys (A power pulley is simply a smaller than standard diameter crankshaft pulley). The different ratios produced by the shims produces a range of pulley ratios for both the standard and power pulleys.
The chart reflects the range in ratios by showings curve for "28mm pwr max" => 28mm wide fan, power pulley, maximum ratio. "34 std min" 34mm wide fan, standard pulley, minimum ratio. and so on... |
The relationship between cooling air speed and the rate of heat transfer.
At first, losing 15% of the cooling air seems like a large sacrifice to make for the slight increase in power that the power pulley provides, but this quote of 15% loss of cooling air is not an accurate indication of the effect on the cooling of the engine. This is because the relationship between the cooling air velocity (or flow) and the rate of heat transferred from the finned surfaces of the engine and the cooling air stream is not linear.
In fact Mackerle (1972, p. 59) states that `the heat transfer coefficient for laminar flow is proportional to vm^0.5 (air velocity to the
power of 0.5), and for turbulent flow to vm (air velocity)’. The cooling fins of an air cooled engine are exposed to a combination of laminar and turbulent air streams. Extensive testing has shown that `the value of vm^0.73 can be regarded as an entirely satisfactory average applicable in calculations for normal cylinders of air cooled engines’ (Mackerle 1972, p. 59). Therefore the relationship between the heat transfer coefficient and the cooling air velocity is given by;
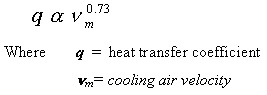
Since vm is proportional to the air flow rate, it can be seen that the 15% (1-0.85) loss of cooling air flow from using the power pulley is equivalent to a 11.2% (1-0.85^0.73) loss in the heat transfer coefficient.
Therefore by using this equation it can be seen that the effect of using the power pulley on the rate of cooling is actually less (only 11.2% loss) than it seemed when the cooling air flow loss was considered (15% cooling air flow loss). |
The effect of a power pulley on air flow, cooling and fan power.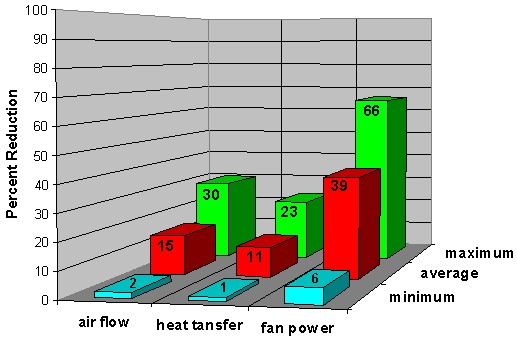
This chart shows the effect of a power pulley on air flow, heat transfer and require fan power. It is shown as a percentage reduction over a standard pulley. There are 3 groups shown, the minimum difference, the maximum difference and the average difference.
As you can see, the power pulley gives a large decrease in fan power with only a small decrease in cooling (heat transfer)
The minimum, maximum and average differences depend on how many shims you use in the generator/alternator pulley with the standard and power pulleys. ie, Adding shims decreases the effective generator pulley diameter (because the belt sits lower in the pulley), which therefore increases the crankshaft to generator pulley diameter ratio (therefore speeding up the fan). |
|
|
|


